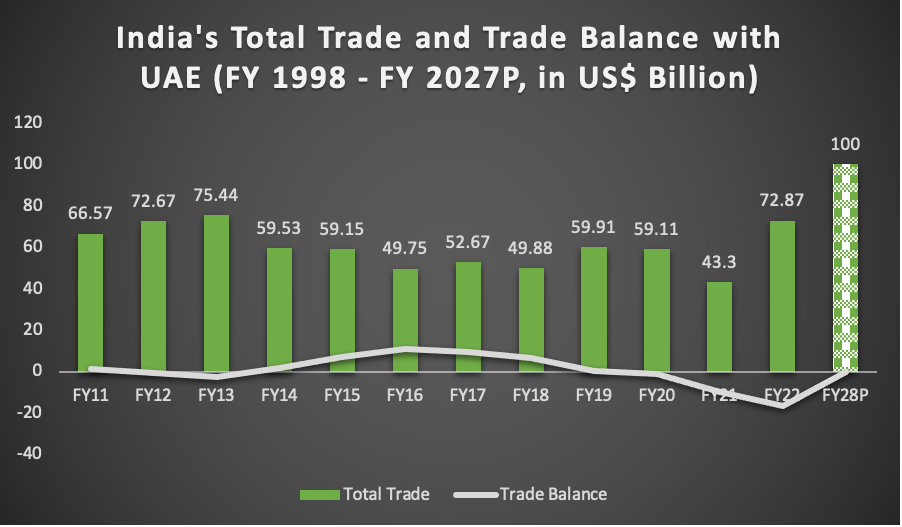
In FY 2021-22, the United Arab Emirates (UAE) was India’s third largest trade partner, with total non-oil bilateral trade valued at US$72.87 billion. Now the two countries have signed a bilateral trade agreement called the Comprehensive Economic Partnership Agreement (CEPA), which came in effect May 1, 2022. The CEPA aims to boost India-UAE annual bilateral non-oil trade to reach the US$100 billion-mark and trade in services to cross over US$15 billion in the next five years. Latest reports already point to a significant 14 percent increase in India's non-oil exports to UAE during the July-August 2022 period, just months after the CEPA came in force.
Having established diplomatic relations in 1972, economic synergies between India and United Arab Emirates (UAE) have continued to deepen, with UAE emerging as India’s third largest trade partner in financial year (FY) 2022 with total non-oil bilateral trade valued at US$72.87 billion. Both countries have further augmented this partnership by signing Comprehensive Economic Partnership Agreement (CEPA), effected from May 1, 2022. This agreement is expected to accelerate growth of annual bilateral non-oil trade to US$100 billion in the coming five years.
Trends in India-UAE bilateral trade
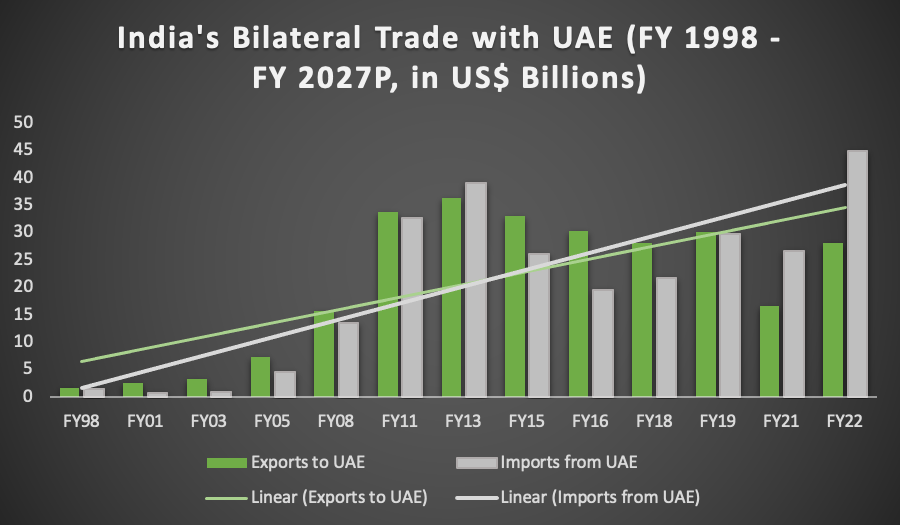
India’s trade relationship with UAE accelerated since the 1950s on the back of improved access to storage facilities and the oil boom, further propelled by emergence of Dubai as a key regional trading hub in 1990s. Post 2004, trade between two countries further gained momentum following free trade agreement (FTA) between India and Gulf countries.
As a result, India-UAE trade volume leaped from US$180 million in 1970s to US$75.44 billion in FY 2013. In subsequent years, India-UAE trade witnessed a slight slump in (US$49.88 in FY 2018). In FY 2021, the Covid-19 pandemic led supply chain and trade disruptions also impacted India-UAE trade flows negatively, falling to about US$42 billion. However, India-UAE bilateral trade bounced back by 68.4 percent year-on-year to reach US$72.87 billion in FY 2022.
It must be noted that along with total trade, the trade gap has also widened between both countries in recent years, in favor of the UAE. In FY 2022, the India's trade deficit with UAE reached its maximum at US$16.78 billion.
|
India-UAE Trade Statistics (in US$ Billion) |
||||
|
Year |
Export from India to UAE |
Import from UAE to India |
Total bilateral trade between India and UAE |
Trade balance |
|
1997-98 |
1.62 |
1.47 |
3.09 |
0.15 |
|
1998-99 |
1.86 |
1.72 |
3.58 |
0.14 |
|
1999-2000 |
2.08 |
2.00 |
4.08 |
0.08 |
|
2000-01 |
2.59 |
0.65 |
3.24 |
1.94 |
|
2001-02 |
2.49 |
0.91 |
3.4 |
1.58 |
|
2002-03 |
3.32 |
0.95 |
4.27 |
2.37 |
|
2003-04 |
5.12 |
2.05 |
7.17 |
3.07 |
|
2004-05 |
7.34 |
4.64 |
11.98 |
2.7 |
|
2005-06 |
8.59 |
4.34 |
12.93 |
4.25 |
|
2006-07 |
12.02 |
8.65 |
20.67 |
3.37 |
|
2007-08 |
15.63 |
13.48 |
29.11 |
2.15 |
|
2008-09 |
24.47 |
23.79 |
48.26 |
0.68 |
|
2009-10 |
23.97 |
19.49 |
43.46 |
4.48 |
|
2010-11 |
33.82 |
32.75 |
66.57 |
1.07 |
|
2011-12 |
35.92 |
36.75 |
72.67 |
- 0.83 |
|
2012-13 |
36.31 |
39.13 |
75.44 |
- 2.82 |
|
2013-14 |
30.52 |
29.01 |
59.53 |
1.51 |
|
2014-15 |
33.02 |
26.13 |
59.15 |
6.89 |
|
2015-16 |
30.31 |
19.44 |
49.75 |
10.87 |
|
2016-17 |
31.17 |
21.50 |
52.67 |
9.67 |
|
2017-18 |
28.14 |
21.73 |
49.88 |
6.41 |
|
2018-19 |
30.12 |
29.78 |
59.91 |
0.34 |
|
2019-20 |
28.85 |
30.25 |
59.11 |
- 1.40 |
|
2020-21 |
16.67 |
26.62 |
43.30 |
- 9.94 |
|
2021-22 |
28.04 |
44.83 |
72.87 |
- 16.78 |
*Data accessed from Department of Commerce on September 24, 2022
Data accessed from Department of Commerce on September 24, 2022
Data accessed from Department of Commerce on September 24, 2022
2027P – Projections as estimated by both countries
What's in the India-UAE trade basket?
While India's major export items to the UAE are diverse, including petroleum products, gems and jewelry, food items, textiles, and engineering goods, India's UAE imports are dominated by petroleum and petroleum products, gems and jewelry, chemicals, etc.
As per data from UN Comtrade, between 2016-2021, India's export basket to UAE was dominated by gems and jewelry sector, which constituted 34.4 percent of total exports. It was followed by coal, oil and gas sector, with an 18 percent share. Other sectors which held considerable weightage include textile articles, industrial goods as well as goods from food and fast moving consumer goods (FMCG) industry.
For the same duration, coal, oil, and gas accounted for a major share of India's imports from UAE, at 46.2 percent. It was followed by gems and jewelry (33 percent), industrial goods (8.4 percent), and metals and mining sector, comprising copper, aluminum, etc.
|
India-UAE Trade Basket: Major Items by Composition |
|||
|
India’s top exports to the UAE (2016-2021) |
India’s top imports from the UAE (2016-2021) |
||
|
Gems and jewelry (34.4%) |
Natural pearls, semi-precious stones and metals
|
Coal, oil and gas (46.2%) |
Mineral fuels, oils and waxes |
|
Coal, oil and gas (18%) |
Mineral fuels, oils and waxes
|
Gems and jewelry (33%) |
Natural pearls, semi-precious stones and metals |
|
Textile and apparel (5%)
|
Knitted Apparel
|
Industrial (8.4%) |
Plastics
|
|
Non-knitted apparel
|
Salt, sulphur, cement
|
||
|
Textile articles
|
Mechanical goods |
||
|
Industrial (8%) |
Mechanical parts
|
Metal and mining (6.8%) |
Copper
|
|
Organic chemicals
|
Iron and steel
|
||
|
Plastics |
Aluminum
|
||
|
Food and FMCG (7%) |
Cereals
|
FMCG (2%) |
Perfume
|
|
Edible fruits and nuts
|
Animals, vegetables, edible fats
|
||
|
Fish and marine products |
Fruits and nuts
|
||
Data compiled from UN Comtrade
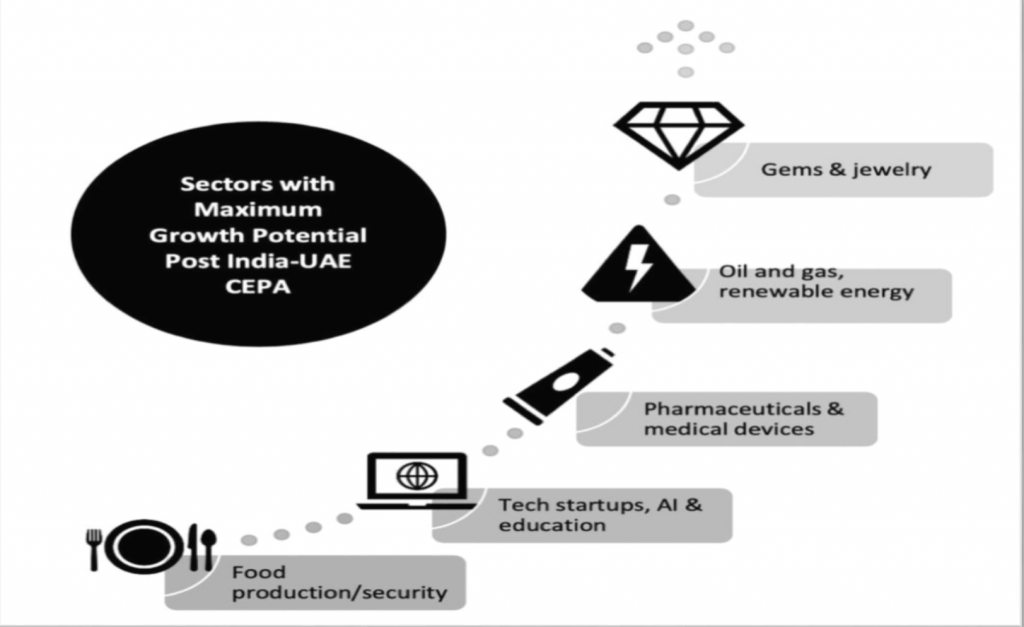
Which sectors stand to gain most from the India-UAE CEPA?
The India-UAE CEPA, which encourages trade through tariff elimination, is expected to accelerate growth of annual bilateral non-oil trade to US$100 billion and trade in services to over US$15 billion in the upcoming five years. Other than aluminum, copper and petrochemicals, pharmaceutical, and agricultural products, the deal also covers services, investments, intellectual property, and a commitment by the UAE to grant 140,000 visas to highly skilled workers from India by 2030. Additionally, the CEPA is also expected to generate one million jobs in India's export-oriented industries like textiles, handloom, gems and jewelry, and leather and footwear.
In fact, speaking at a recent India-UAE event hosted to welcome low-cost carrier (LCC) IndiGo’s maiden direct flight between Mumbai and Ras Al-Khaimah, India's envoy to UAE Sunjay Sudhir stated that both countries are expected to meet the US$100 billion target well before the five-year deadline.
As per the latest trade statistics released by the Department of Commerce for July-August 2022 period, India’s non-petroleum exports to the UAE grew by 14 percent year-on-year, just months after the CEPA came into effect. Electrical machinery exports to the UAE were up by 67 percent during this period, reaching US$916 million as compared to US$549 million in the June-August period in 2021. Gems and jewelry exports grew 33 percent to US$1.4 billion in the same three-month period. Inorganic chemicals shipments to the UAE were up by 74 percent to reach US$157 million.
The trend indicates a positive impact of the trade pact on India's export trajectory, despite significant macroeconomic headwinds, such as the conflict in Ukraine, COVID-19 related lockdowns in China, rising inflationary pressures, global growth slowdown and consequent reduced demand, and reduction in global merchandize trade.
Source: Analysis from - Strategy for New India @ 75, UAE Vision 2021, UAE Operation 300 billion